oil market
The IEA Oil Market Report (OMR) is one of the world’s most authoritative and timely sources of data, forecasts and analysis on the global oil market – including detailed statistics and commentary on oil supply, demand, inventories, prices and refining activity, as well as oil trade for IEA and selected non-IEA countries.
- World oil demand is forecast to increase by 720 kb/d in 2025. This is marginally below last month’s estimate, as weak 2Q25 deliveries in the United States and China undercut resilience elsewhere. Growth in 2026, at 740 kb/d, will be held back by a challenging economic outlook and the uptake of clean energy technologies.
- Global oil supply rose by 330 kb/d in May to 105 mb/d, 1.8 mb/d above a year ago. Monthly gains were evenly split between non-OPEC+ and OPEC+ as the producer alliance started unwinding some voluntary production cuts. World oil supply is projected to rise by 1.8 mb/d to 104.9 mb/d in 2025 and by 1.1 mb/d in 2026, led by non-OPEC+ gains of 1.4 mb/d and 840 kb/d, respectively.
- Refinery throughputs are forecast to rise by around 460 kb/d in both 2025 and 2026, to average 83.3 mb/d and 83.7 mb/d, respectively. Refining margins in May were at their highest levels since 1Q24. However, the rally in crude prices in early June squeezed profitability levels as gasoline, naphtha and fuel oil cracks weakened.
- Russian crude and product exports fell by 230 kb/d m-o-m to 7.3 mb/d in May, down 380 kb/d y-o-y. As oil prices slid, revenues declined by $480 million m-o-m to $12.6 billion, a plunge of $4.0 billion y-o-y. May’s crude export revenues hit their lowest level since February 2021 and products their lowest since June 2023.
- Global oil stocks rose for a third consecutive month, by 32.1 mb in April to 7 717 mb, led by builds in crude oil inventories in the non-OECD. While global stocks built by 1 mb/d on average since February, total inventories remain 90 mb lower y-o-y. OECD industry stocks fell by 9 mb to stand 97 mb below a year ago. Preliminary data show global oil inventories surged in May.
- Brent futures rallied by $5/bbl to $74/bbl after Israel’s 13 June air strikes on Iran’s nuclear and military facilities. May and early June prices were range-bound as trade tensions subsided somewhat after the United States and China agreed a three-month tariff détente. Conversely, plans by OPEC+ to accelerate the unwinding of voluntary output cuts added to the prospect of comfortable 2H25 balances.
Geopolitical risk in focus
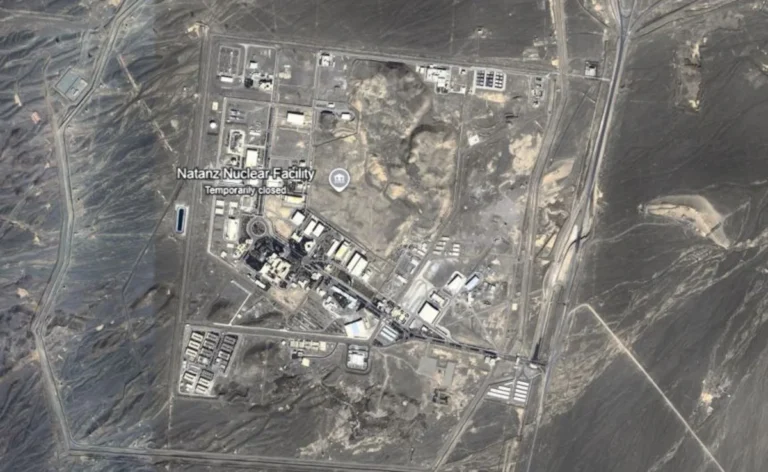
Global oil markets were roiled by a rapid escalation in geopolitical tensions after Israel launched a series of air strikes on targets in Iran on 13 June and Tehran retaliated. The two countries have fought a shadow war for decades, but the current conflict is the most severe, with energy infrastructure also targeted for the first time. While there was no impact on Iranian oil flows at the time of writing, fears of a widening regional disruptions to oil traffic through the crucial Strait of Hormuz drove oil prices higher, with Brent crude futures reaching a six-month high of $74/bbl.
Iran currently produces around 4.8 mb/d of crude, condensates and NGLs, with total oil exports of about 2.6 mb/d. While the US administration has recently intensified sanctions on buyers of Iranian oil supplies, Iran’s exports of crude and condensates have remained unchanged, averaging around 1.7 mb/d so far this year, with most of it going to China. Iran is also a significant oil product exporter, with shipments of fuel oil, LPG and naphtha averaging nearly 800 kb/d since January.
Iran partially suspended production at the world’s biggest natural gas field, South Pars, after an Israeli strike caused a fire in what would be the first Israeli attack on Iran’s oil and gas sector. It is still unclear if condensate and NGL production from the South Pars Phase 14 field has been impacted. It has a capacity of 2 bcf/d of gas, 75 kb/d of condensate and roughly the same amount of ethane and LPG. The Shahran oil depot and refinery near Tehran were also targeted, but reportedly no major damage occurred. Israel meanwhile has halted more than 60% of its natural gas production capacity, including at the offshore Leviathan field, on security concerns, and has reported that Iranian strikes have damaged its Haifa refinery.
Iran has repeatedly threatened to close the key Strait of Hormuz if attacked. Closure of the Strait, even for a limited period, would have a major impact on global oil and gas markets. The Strait is the exit route from the Gulf for around 25% of the world’s oil supply – including from Saudi Arabia, the UAE, Kuwait, Qatar, Iraq and Iran – and most of the world’s spare production capacity.
In the absence of a major disruption, oil markets in 2025 look well supplied. World oil demand is forecast to increase by 720 kb/d this year, marginally below last month’s estimate as weak 2Q25 deliveries in the United States and China undercut resilience elsewhere. Meanwhile, global oil supply in May was up by 1.9 mb/d from a year ago, led in part by the unwinding of voluntary OPEC+ production cuts. For 2025 as a whole, world oil supply is projected to rise by 1.8 mb/d to 104.9 mb/d and by an additional 1.1 mb/d in 2026. Non-OPEC+ producers are forecast to add 1.4 mb/d on average this year and 840 kb/d next year.
With supply exceeding demand, global observed oil inventories have risen by 1 mb/d on average since February, and by a massive 93 mb in May alone, according to preliminary data available. But while the market looks comfortably supplied now, the recent events sharply highlight the significant geopolitical risks to oil supply security. The IEA remains deeply committed to working with energy producers and consumers to safeguard energy security.
| Apr 2025 Supply | May 2025 Supply | May 2025 vs Target | May 2025 Implied Target1 | Sustainable Capacity2 | Eff Spare Cap vs May3 | |
|---|---|---|---|---|---|---|
| Algeria | 0.93 | 0.93 | 0.01 | 0.92 | 0.99 | 0.06 |
| Congo | 0.24 | 0.23 | -0.05 | 0.28 | 0.27 | 0.04 |
| Equatorial Guinea | 0.06 | 0.06 | -0.02 | 0.07 | 0.06 | 0.01 |
| Gabon | 0.22 | 0.25 | 0.07 | 0.18 | 0.22 | 0 |
| Iraq | 4.22 | 4.19 | 0.28 | 3.91 | 4.87 | 0.68 |
| Kuwait | 2.65 | 2.62 | 0.19 | 2.43 | 2.88 | 0.26 |
| Nigeria | 1.49 | 1.48 | -0.02 | 1.5 | 1.42 | 0 |
| Saudi Arabia | 8.94 | 9.12 | -0.08 | 9.2 | 12.11 | 2.99 |
| UAE | 3.25 | 3.35 | 0.35 | 3.0 | 4.28 | 0.93 |
| Total OPEC-9 | 21.99 | 22.22 | 0.74 | 21.48 | 27.1 | 4.96 |
| Iran4 | 3.45 | 3.48 | 3.8 | |||
| Libya4 | 1.24 | 1.26 | 1.23 | 0 | ||
| Venezuela4 | 0.83 | 0.8 | 0.89 | 0.09 | ||
| Total OPEC | 27.51 | 27.76 | 33.02 | 5.05 | ||
| Azerbaijan | 0.45 | 0.47 | -0.08 | 0.55 | 0.49 | 0.02 |
| Kazakhstan | 1.85 | 1.84 | 0.47 | 1.37 | 1.8 | 0 |
| Mexico5 | 1.46 | 1.47 | 1.59 | 0.12 | ||
| Oman | 0.75 | 0.76 | 0.0 | 0.76 | 0.85 | 0.09 |
| Russia | 9.27 | 9.17 | 0.17 | 9.0 | 9.76 | |
| Others 6 | 0.74 | 0.74 | -0.13 | 0.87 | 0.86 | 0.12 |
| Total Non-OPEC | 14.54 | 14.45 | 0.44 | 12.54 | 15.34 | 0.34 |
| OPEC+ 18 in Nov 2022 deal5 | 35.06 | 35.2 | 1.17 | 34.03 | 40.85 | 5.18 |
| Total OPEC+ | 42.05 | 42.21 | 48.36 | 5.39 |